Signal Processing in Computer Graphics #3: Signals
, an example of signal.")
Overview
Let's introduce the definition of signal, and some of the properties used to describe it.
In this pages you'll find some shaders written with Shadertoy, and some Desmos graphs. Read how to use the interactive content in this site.
What is a signal
As stated in the Introduction a signal, broadly speaking, is any quantity that vary in space or time. Let's see some examples.
One dimensional signal
A simple example is the $sin(x)$ function: a function of one variable, defined for each real value. It is a continuous time one dimensional signal. It repeats identically each $2\pi$, so it's periodic, and $2\pi$ is it's period. This latter is releated to the frequency, defined as:
$$frequency = \frac{1}{period}$$
that is the number of complete cycles per seconds.
Think to a signal that repeat identically every 2 seconds (period), it means that he does 1/2 cycle every second (frequency).
The amplitude of a signal is of how much it extends from the top to the bottom. The signal can also be shifted, vertically or horizontally.
The following graph shows the function $sin(x)$. You can tweak some paramer and modify its period and frequency, it's amplitude and shifts.
Two dimensional signal
A signal doesn't have to be limited to one dimension. Indeed it could have any.
The function $$f(x,y) = (\lfloor {x} \rfloor + \lfloor {y} \rfloor) \bmod 2$$ that gives us a checkboard pattern, it's an example of a two dimensional signal.
| A checkboard pattern, a 2D signal |
|---|
The frequency domain
Usually a signal is the sum of several frequencies. For example consider the following function: $$f(x) = sin(2x) + sin(x) + 2 $$.
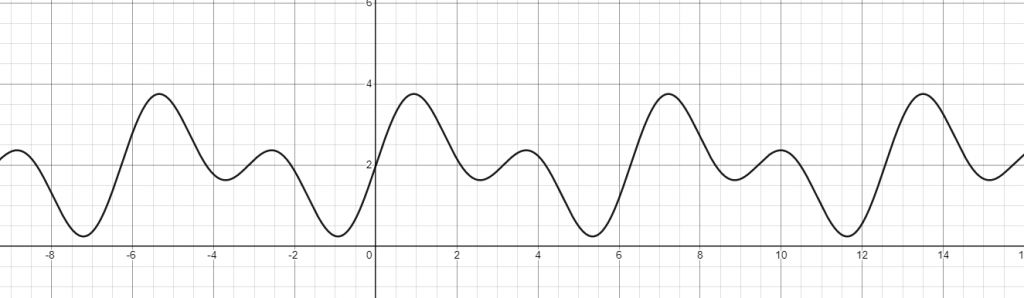
This is the sum of two $sin$ functions, one with $\frac{1}{2\pi}$ and one with $\frac{1}{\pi}$ frequency.
A signal represented in the frequency domain is a plot of all the frequencies which it is made up, differently from the representation seen until now, that is in the time domain, considerint the independent $x$ variable as the time.
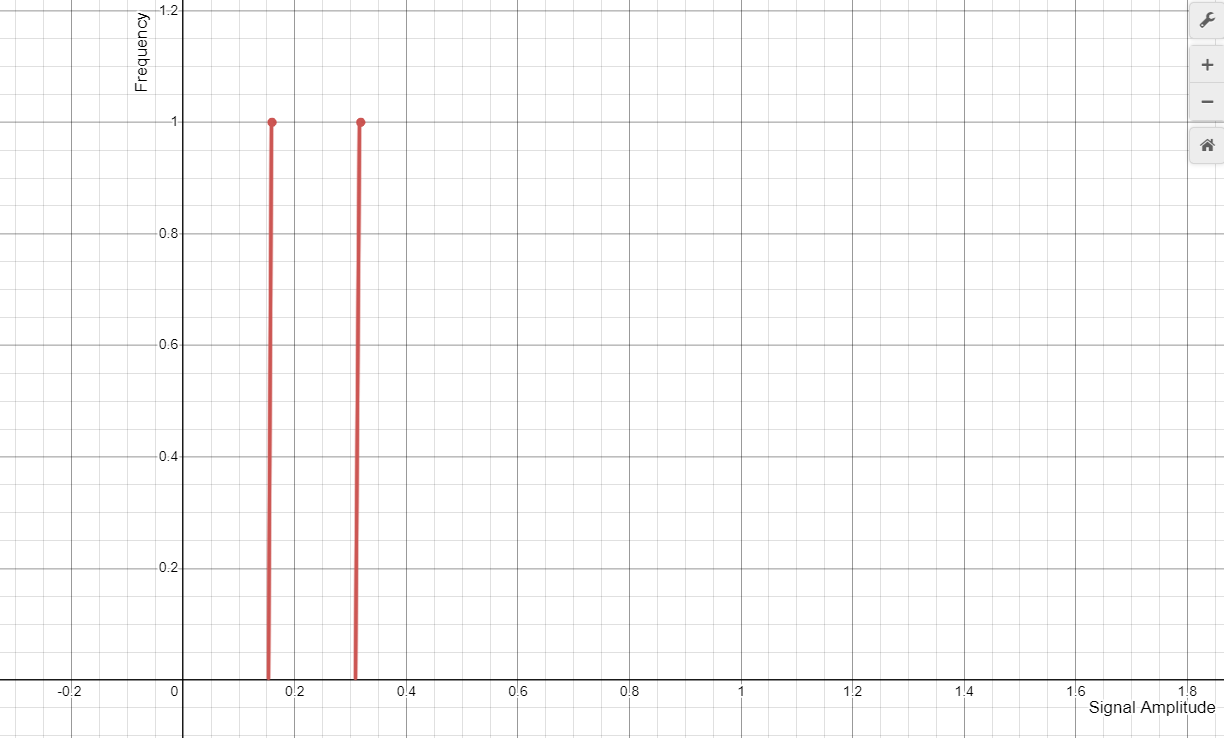
The mathematical tool used to transform a signal from the time domain to the frequency domain is the Fourier Transform. Here, from the 3Blue1Brown channel, there is a great explanation of the fourier transform.
If a signal has no frequencies over a maximumum value, it's bandlimited.
It's really important to see a signal from the perspective of the frequencies domain. Indeed the aliasing come from insufficient sampling, compared to the maximum frequency, of from sampling signals that are not bandlimited.
That's it for now. See you next time !!!
Posts in this series
- Signal Processing in Computer Graphics #6: AntiAliasing
- Signal Processing in Computer Graphics #5: Texture Filtering
- Signal Processing in Computer Graphics #4: Sampling and Filtering
- Signal Processing in Computer Graphics #3: Signals
- Signal Processing in Computer Graphics #2: Introduction
- Signal Processing in Computer Graphics #1: Overview